Definition of Terms
Water Management Cluster
An industry “cluster” is a regional concentration of related economic activities. The Coastal Index defines the water management cluster as the set of activities related to coastal restoration and protection, urban water management, and subsidence management. To quantify this cluster in a manner that is consistent with available industry-level employment data, The Coastal Index combines two clusters from Harvard’s U.S. Cluster Mapping Project, which classifies standard industry definitions (NAICS) into mutually exclusive clusters based on inter-industry trade patterns and geographic concentration. As classified by that research, the “construction products & services” and “business services” clusters encompass many of the activities most closely associated with the design and protection of coastal protection and water management infrastructures. The construction products & services cluster includes advanced construction industries imperative for moving earth and water, and the business services cluster includes important high-skill industries necessary for the design, engineering, and system integration of coastal and inland water management projects.
The U.S. Cluster Mapping Project is a national study. Although a useful benchmark, like any method for categorizing economic activity, it has limitations. For example, emerging and uniquely localized industries and industry clusters, such as water management, are likely to be imperfectly classified because the data is based on previous years and the general industrial makeup of the nation. In addition, the U.S. Cluster Mapping Project treats every cluster as mutually exclusive and each industry as belonging to a single cluster. Thus, the definition of water management used here undoubtedly both undercounts and overcounts employment for different industries within the cluster. For more detail on these issues, see a recent The Coastal Index companion brief entitled, Changing coast, evolving coastal economy: The water management cluster in Southeast Louisiana in retrospect and prospect, which discusses conceptual and methodological limitations of industry cluster definitions, both in general and with specific references to water management. The report also conducts a more detailed industry-level analysis to refine the cluster definition and to identify large, growing industries within the cluster.
To give an example of the challenge with defining water management activities, because there is no dedicated industry category for the construction of levees and related coastal infrastructures, these activities are most likely to fall under “Other Heavy and Civil Engineering Construction” instead of a more specific heavy infrastructure category. Indeed, this industry is extremely concentrated in Southeast Louisiana, and its employment has doubled since before Hurricane Katrina. As a result, employment in this industry can be linked to coastal protection and water management with confidence. In contrast, Engineering Services, though large and clearly related to the design of water management infrastructures, cannot be as directly linked to water management activities. It bears emphasis that similar definitional issues are common to cluster studies.
Super Region
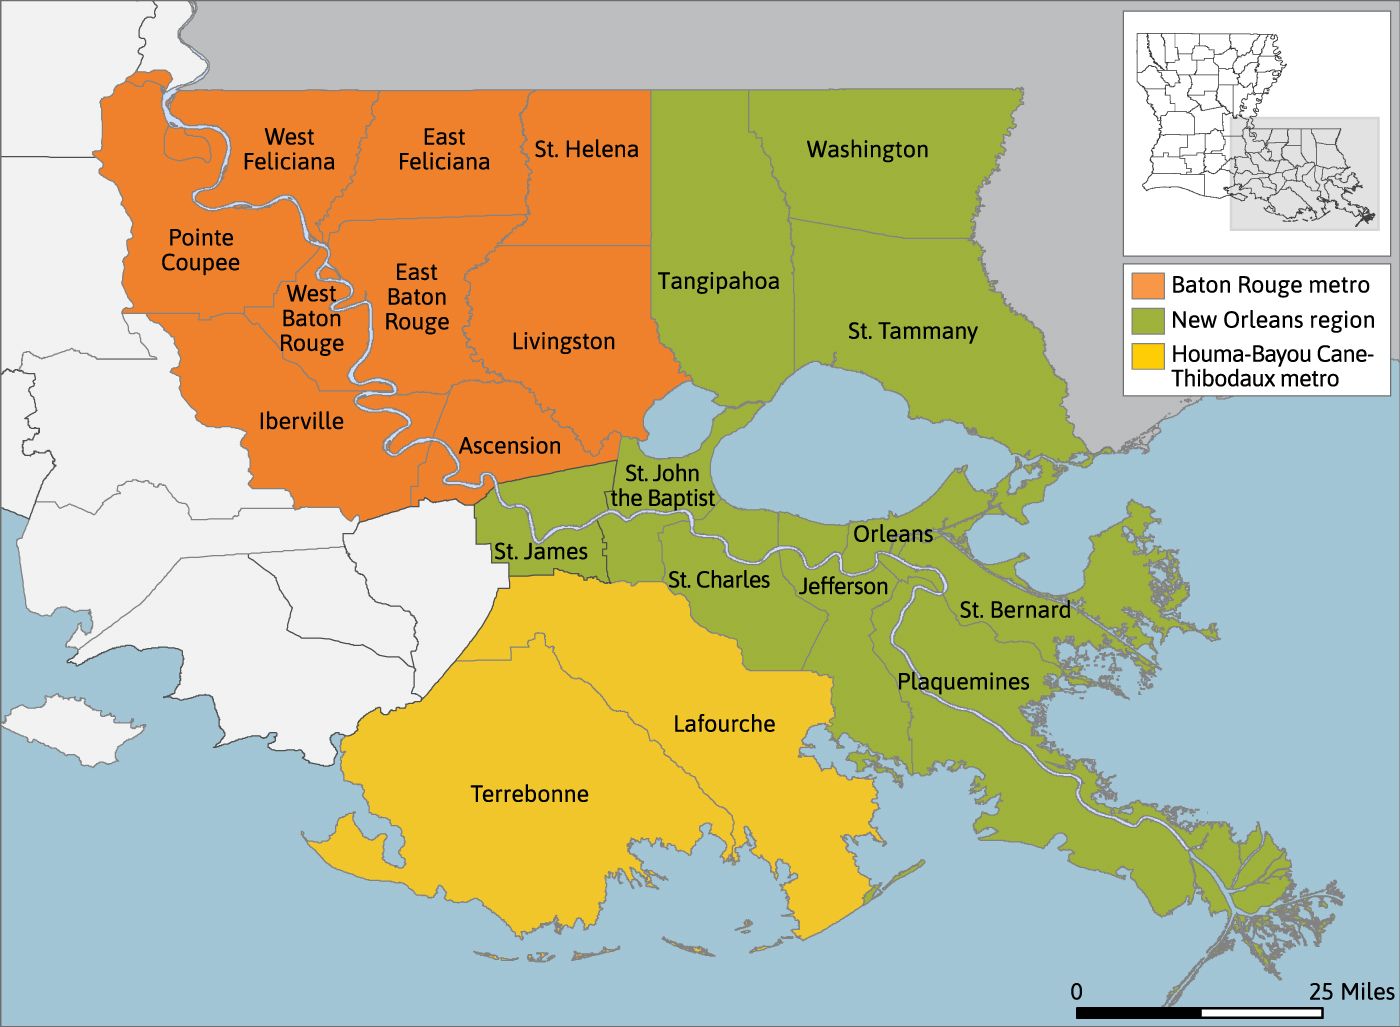
The Southeast Louisiana Super Region is composed of the three metropolitan statistical areas (MSAs) – New Orleans-Metairie, Baton Rouge, and Houma-Thibodaux – and two additional parishes – Tangipahoa and Washington. There are 21 parishes in the Super Region. Our previous research found that the parishes in the Super Region were highly synergistic and interconnected. Economic development leaders have formed the Southeast Super-Region Committee (or SoLA) to collaborate across this broader geography. The economic data in this report reflects all of these parishes as a single unit. The terms “Super Region” and “Southeast Louisiana” are used interchangeably.
Comparison metros
For some indicators, the Southeast Louisiana Super Region is compared to a group of nine metros that have comparable regional specializations in water management:
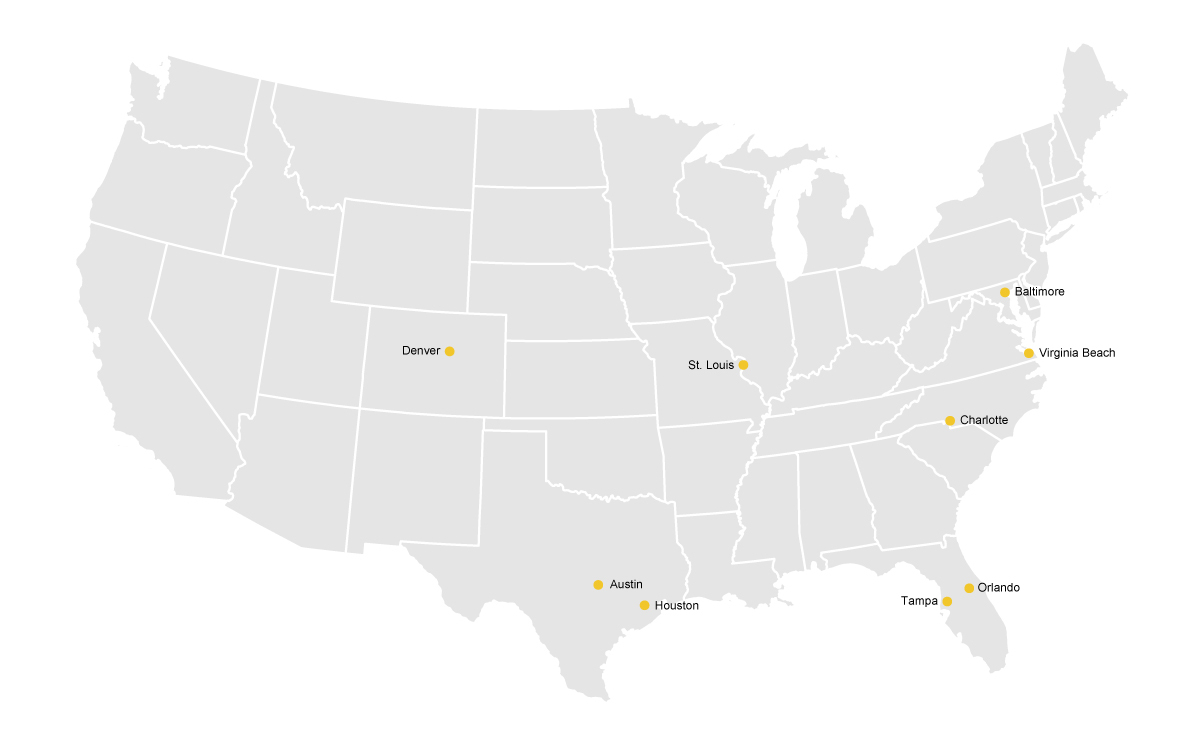
These metros were selected for their similarities to the Super Region across a number of different measures. The most important similarity among the chosen metros is an employment concentration in water management industries, for which we considered two criteria. Eight of the nine metros have either a water management location quotient greater than one or a water workforce (as defined according a 2018 report from Brookings that used a different definition than The Coastal Index) that makes up at least 1.2 percent of its employment, which puts them among the top 50 cities by share of water jobs. Four of the metros meet both of these criteria. Additional considerations are population size and Gross Domestic Product (GDP) per capita as approximations of the size and output of a regional economy (GDP per capita is commonly considered to be a proxy for standard of living). A final consideration is historical or cultural similarity to New Orleans. St. Louis, Tampa, and Houston have historical and geographical similarities with Southeast Louisiana. To smooth variation between these regions, they are represented as a composite “Comparison metro.”
Years of analysis
Most of the data included in this report covers 2010 to 2018, many of the indicators being annual averages over this time period. 2010 is a natural starting point for economic, social, and political indicators covered in this index as it was the first full year out of the Great Recession, as well as the year of the Deepwater Horizon oil spill.
Glossary
BERM
Berm to Barrier. A project led by the CPRA whose purpose is to build a more sustainable barrier island chain which might serve as a “first line of defense” against storm surge and environmental degradation. It takes advantage of emergency berms created after the Deepwater Horizon Oil Spill.
CDBG
Community Development Block Grant. A program funded by the U.S. Department of Housing and Urban Development. Funds were allocated to Louisiana after Hurricanes Gustav and Ike for coastal protection and restoration.
CIAP
Coastal Impact Assistance Program. It provides federal grant funds derived from federal offshore lease revenues to states that have been affected by oil and gas exploration so that they may engage in activities aimed the conservation, protection, or restoration of coastal areas.
CPRA
Coastal Protection and Restoration Authority. A Louisiana state agency whose mandate is to develop, implement, and enforce a comprehensive coastal protection and restoration Master Plan.
CWPPRA
Coastal Wetlands Planning, Protection and Restoration Act. Federal legislation enacted in 1990 designed to identify, prepare, and fund coastal wetland restoration projects.
EPA
Environmental Protection Agency. Its overarching objective is to protect human health and the environment.
FEDERAL
Restoration and protection projects planned and funded entirely by the federal government.
FEMA
Federal Emergency Management Agency. It supports people and first responders to help build and improve protection against future emergencies.
HSDRRS
Hurricane and Storm Damage Risk Reduction System. It is an overhaul of the federal levees, floodwalls, and other protective measures in the wake of Hurricane Katrina.
HUD
U.S. Department of Housing and Urban Development. Its mission is to develop and execute policies on housing in metro areas.
LOCATION QUOTIENT
A ratio comparing a particular region to a larger reference region according to one industry or characteristic. For example, a particular industry’s share of jobs in the Super Region is compared to that industry’s share of jobs in the U.S. This quotient represents the degree of concentration of a given industry within a region as compared to the national average.
MASTER PLAN
A plan published every five years by the CPRA to guide future coastal protection and restoration in the State of Louisiana.
MITIGATION
According to the U.S. Council on Environmental Quality, mitigation is the process of avoiding impact by not taking an action, minimizing the impact, rectifying the impact by repairing or restoring the affected environment, reducing the impact over time by preservation, or compensating for the impact by replacing or substituting resources or environments. For example, when a company plans to engage in activity that will damage the environment, such as building a pipeline, it should mitigate the environmental degradation created this project by restoring the environment elsewhere in the region.
NAICS
North American Industry Classification System. It is used by federal statistical agencies to classify businesses.
NFWF
National Fish and Wildlife Foundation. It awards funds from the Gulf Environmental Benefit Fund to projects in Louisiana.
NMFS
National Marine Fisheries Service, also known as NOAA Fisheries. It is responsible for promoting sustainability and conservation within the living marine resources and habitats of the U.S.
NOAA
National Oceanic and Atmospheric Administration. It conducts research and provides services aimed at protecting the environment.
NRCS
Natural Resource Conservation Service. It provides technical and financial assistance to producers who implement conservation strategies.
NRDA
National Resource Damage Assessment. It is the process through which claims for natural resource damages caused by the Deepwater Horizon Oil spill are executed. This process will continue until the full extent of the damages is determined, and restoration plans have been executed.
OIL SPILL
Projects that have received oil spill funds.
RESTORE ACT
Resources and Ecosystems Sustainability, Tourist Opportunities, and Revived Economies of the Gulf Coast States Act. An act established after the Deepwater Horizon Oil Spill to create the Gulf Coast Restoration Trust Fund. Eighty percent of all civil penalties for the oil spill will be used for restoration and protection in the Gulf Coast region.
RFP/RSIQ
Request for Proposal / Request for Statement of Interest and Qualifications. A solicitation made by the CPRA for business proposals by service companies to determine the company’s plans, qualifications, and bid.
STATE
Restoration projects funded primarily by the State of Louisiana.
STEM
Science, Technology, Engineering, and Mathematics.
USACE
United States Army Corps of Engineers. Its objective is to strengthen infrastructure while striving for environmental sustainability.
USFWS
United States Fish and Wildlife Services. It assists in the conservation and development of U.S. fish and wildlife resources.
WRDA
Water Resources Development Act of 2007 that authorized the Louisiana Coastal Area Program to implement restoration and protection projects in order to slow coastal wetland loss.
Technical Notes
Demand Drivers
U.S. Army Corps of Engineers (Army Corps)
The source of all Army Corps contracts is USASpending.gov, a federal contracts database mandated by the Federal Funding Accountability and Transparency Act (FFATA) of 2006, managed by the Office of Management and Budget (OMB), and operated by the General Services Administration. The contracts data found in this database are from the Federal Procurement Data System-Next Generation. Army Corps contracts were all contracts that fell under “CORPS OF ENGINEERS - CIVIL WORKS (USACE)” for “funding_agency_name” in the USASpending.gov database (i.e., contracts that were funded by Army Corps of Engineers civil program financing).
Construction and Services Contracts
Contracts that fall under services are those for which the NAICS code description includes the word “services.” Those under construction are those for which the NAICS code description includes the word “construction.” Contracts with a NAICS code that did not include the words “services” or “construction” fell into the miscellaneous category. All data collected were on prime contractors only. All negative entries were excluded.
In order to collect data exclusively on contracts performed in Louisiana between 2010 and 2022, The Data Center restricted the data from USASpending.gov to only contracts where Louisiana was the principal place where work was performed between the years 2010 and 2022. Yearly contracts represent awards between 2010 and 2022, but not necessarily completed contracts.
When collecting data on Louisiana-based firms and outside firms, The Data Center used vendor locations specified in the USASpending.gov data. The location of performance state was defined as the state where the majority of the work was performed.
The Coastal Protection and Restoration Authority
Projected Expenditures
Data comes from CPRA projections of expenditures in six categories for fiscal years 2024, 2025 and 2026. FY 2024 begins halfway through 2023 and ends halfway through 2024.
CPRA Regular Services Contracts
Data reflects a compilation of payments for "Regular Services" provided by the CPRA at the request of The Data Center. These payments were queried from records in LaGov, the State government’s enterprise resource planning system, and then coded under the following RFP/RSIQ types by CPRA staff: Engineering, Environmental, Geotechnical, Land Rights, and Surveying. These contracts are "Indefinite Delivery Indefinite Quantity," which means that final contract work may total to less than the full amount. Not included are one-off service contracts, often associated with a specific disaster or project and support service contracts, which are usually administrative contracts. Services contracts data reflect only CPRA-led projects where indicated. Only data from FY 2018-2023 are used for the charts, which reflects the shift to the LaGov system that rendered the data not directly comparable with data from earlier years. Earlier data under the previous system was previously published in print editions of The Coastal Index.
CPRA-Led Construction Contracts
Data reflects a compilation of payments for construction provided by the CPRA at the request of The Data Center. As with the services payments described above, these records come from the LaGov system. Construction contracts data reflect only CPRA-led projects where indicated. The values reflect payments for work completed during the fiscal year indicated, which is not necessarily when a project’s construction phase was initiated or completed, since many purchase orders span many years.
The full value of a construction contract is reported in the year the contract was awarded. However, there are uncompleted construction contracts awarded between 2007 and 2014 not included in this data. Likewise, there are construction contracts completed between 2007 and 2014 awarded before 2007 not included in this data.
Partner-Led Contracts
Federal, state, and local partners in CPRA partner-led projects give out their own construction and services contracts. In many cases, these partner-led contracts are with local governments or local levee authorities. In addition, CPRA may give out contracts associated with planning and designing partner-led projects. Partner-led project data reflects total project costs, encompassing all associated contracts (construction, services, miscellaneous, admin) and admin or "other" costs.
CPRA Location of Firm
For services and construction contracts, a Louisiana firm was defined as a firm headquartered in the state of Louisiana through a mix of resources, including the Secretary of State website, information provided by the CPRA, various online business databases, internet searches and review of company websites.
Mitigation banks
Mitigation banks data comes from RIBITS, the Regulatory In-Lieu Fee and Bank Information Tracking System, which was developed by the Army Corps to provide information on mitigation and conservation banking in the United States. In it, individual corps districts record every action taken by a mitigation bank sponsor with regards to a mitigation property. When a property is approved, the details are recorded, when credits are released, the details are recorded, and when credits are withdrawn (i.e. purchased), they are also recorded. Acre estimates are included as well for each transaction. Credits are released once a portion of mitigation work has been completed, so when credits are purchased, much of the restoration work has already been done.
Market Cap
Eco-Asset Solutions & Innovations (EASI) assembles data on mitigation credit transactions to increase transparency around credit pricing and to understand credit price volatility. The Data Center obtained this data for Louisiana, and the sample of credit transactions over the past decade shows a range in mitigation credit prices from $13,000 to $197,000 per credit – volatile indeed.
Wetland credits vary in price depending on wetland type, location, supply, and numerous other factors. The average sales price of $38,000 was calculated by using the credit prices reported by EASI from 2010 to 2020, with the highest and lowest price credits removed to dampen the influence of price volatility on the average.
This data does not include any in-lieu fee program mitigation or permittee-responsible mitigation, which is mitigation done in an ad-hoc manner when sufficient or appropriate bank credits are not available in a given watershed. These two excluded types of mitigation were calculated by an Army Corps report in 2014 to be 3 percent and 18 percent of total mitigation in the Mississippi Valley, respectively. As a result, the market cap value of wetland mitigation bank credits included in this report may underestimate the full value of mitigation work in Louisiana.
Louisiana Contractors Performing Work Outside of Louisiana
Data reflects total obligated amount (in dollars) by the Army Corps to companies with headquarters within Louisiana for contracts performed outside Louisiana. Totals may reflect multiple contracts across multiple states and multiple years. Company names reflect vendor names reported at the time and may include companies no longer headquartered in Louisiana, or vendors that have since been purchased by outside firms.
Competition Between States for Army Corps Contracts
In-state total reflects the total obligated amount (in dollars) by the Army Corps to companies with headquarters within that state for contracts performed within that state. In-state share is that total divided by the total obligated amount for contracts performed within that state. Out-of-state total reflects the total obligated amount to companies with headquarters within that state for contracts performed outside the state. Out-of-state share is that total divided by the total obligated amount for contracts performed outside of that state.
Industry & Workforce
Water management job growth and wages
The data used for the water management average annual wage, job growth, location quotient, and demographic indicators come from Lightcast, formerly known as EMSI. Lightcast is a private data provider that compiles high-quality employment data by removing the suppressions that are characteristic of publicly available county-level datasets. The 6-digit NAICS codes that comprise The Data Center economic definition of water management can be found in the downloadable data tables.
Social Context
Educated Workforce
Educational Attainment
Data reflect the U.S. Office of Management and Budget definitions of the comparison metros from September 2018 for 2000, and 2018 data, and from December 2009 for 2010 data. For the Southeast Louisiana Super Region, the data reflects the current definition of the region, which includes the New Orleans, Baton Rouge, and Houma-Thibodaux Metropolitan Statistical Areas, in addition to Tangipahoa and Washington Parishes. For the 2010 data, Washington Parish is not included because the population of the parish was <65,000 at the time so educational attainment numbers could not be obtained due to American Community Survey population cutoffs. Populations with at least some college include those who have attained no degree, an Associate’s degree, a Bachelor’s degree, and/or a graduate or professional degree. Populations with a Bachelor’s degree or higher have either a Bachelor’s degree, and/or a graduate or professional degree.
Science, Engineering, and Technology Bachelor's
Data is from the National Science Foundation publication of Science and Engineering Indicators. The SEI is prepared by the National Center for Science and Engineering Statistics (NCSES), a part of NSF. The SEI is a record of indicators that provide information on the science and engineering sector of the economy.
The Science and Engineering Bachelor’s per 1000 individuals, 18-24 years old data reflect NSF analysis of data from the Integrated Postsecondary Education Data System (IPEDS), as well as Census Bureau population data. Eighteen to 24 year olds were chosen to represent the age of the majority of people pursuing a Bachelor’s degree. Science, Engineering, and Technology was defined by NCSES as physical, life, earth, ocean, atmospheric, computer, and social science; mathematics; engineering; psychology; science technologies; and engineering technologies. The state rankings shown are out of all 50 states and the District of Columbia.
State Funding for Higher Education
Funding dollars are adjusted by the SHEEO Higher Education Cost Adjustment (HECA), which adjusts for inflation based on the typical spending of a public higher education institution, rather than the spending of a typical consumer. Educational appropriations are a measure of state and local support available for public higher education operation expenses, including ARRA funds, and exclude appropriations for independent institutions, financial aid for students attending independent institutions, research, hospitals, and medical education. Full-time equivalent enrollment (FTE) equates student credit hours to full-time, academic year students, but excludes medical students.
Philanthropic spending
The data used for the philanthropic support indicators comes from the Foundation Center. Foundation Center is the leading source of philanthropic information with the most comprehensive database on United States grantmakers and grants. The Foundation Center compiles their data from IRS information returns, grantmaker websites, annual reports, printed application guidelines, the philanthropic press, and more than 30 other sources. The Foundation Center only has data on foundation grants, not individual donations.
Total and environmental grant giving were calculated by summing the grants that were awarded by grantmakers located in the Super Region and used for projects within the Super Region.
Research & development
Data are from the National Science Foundation publication of Science and Engineering Indicators (SEI). The SEI is prepared by the National Center for Science and Engineering Statistics (NCSES), a part of NSF. The SEI is a record of indicators that provide information on the Science and Engineering sector of the economy.
Academic Science & Engineering
The academic Science & Engineering R&D per $1,000 GDP data reflects the ratio of Science and Engineering R&D expenditures at colleges and universities within a state to the size of the state’s economy. Data reflects the NSF definition of Science and Engineering as the fields of: physical, life, earth, ocean, atmospheric, computer, and social science; mathematics; engineering; and psychology. Academic research accounts for about 15 percent of the all research and development done in the United States and more than half of basic research. Academic R&D can serve as an important indicator for future knowledge and economic progress. R&D data after 2009 comes from the NCSES Higher Education Research and Development Survey, while data before 2009 comes from the NCSES Survey of Research and Development Expenditures at Universities and Colleges, where data on expenditures by field are collected. Academic R&D is only reported for institutions with more than $150,000 in R&D .
Business-Performed
The business-performed R&D per $100 private industry output data reflect the share of R&D in the business activity of a state. Private industry output is a BEA-designated subset of GDP that is the part of GDP that is added by businesses. For business-performed R&D data, the NSF used two surveys. The Survey of Industrial Research Development, an annual survey completed by companies to create industry performed R&D information, was used by the NSF until 2007. Subsequently, the Business R&D and Innovation Survey, led by the Census Bureau, was launched. The new survey is better designed to capture R&D as it is currently conducted. These two surveys have consistent findings.
Federal Obligations
The federal R&D obligations per employed worker data reflects geographical disbursement of federal R&D obligations relative to the size of the employed workforce in a state. The dollar amount is accredited to the state of residence of the recipients. The data on federal R&D obligations were collected from the NCSES which carries out an annual census of federal agencies. The data on state workforce were taken from the BLS.
State Agency
The state agency R&D per one million dollars GDP data reflect the ratio of R&D funded by state agencies to the size of the state’s economy. Data reflects the NSF definition of state R&D funding, excluding state-run universities and colleges or college-controlled laboratories. The data also excludes any appropriations to non-state agencies that come directly from the state legislature. The state R&D data was collected through NCSES’s Survey of State Research and Development, a biennial survey to determine expenditures by performer, source funding, and type of R&D . The BEA’s data for GDP was used for output.
Coastal Change
Projected Coastal Land Loss
The two maps represent the 2023 Coastal Master Plan’s predicted land change over the next 50 years under a lower environmental scenario. The maps are reproduced as provided for download by the 2023 Coastal Master Plan Data Viewer.
Population Change
The map compares the population of block groups in 2010 and 2020. Because 2010 and 2020 block groups have different boundaries, they are not directly comparable. To make the boundaries consistent, block-level 2010 populations were spatially joined to 2020 block groups, which forms the basis of the comparison shown on the map.